
Stuyvesant Insight: The Copper-Gold Ratio
/An announcement that China is looking to ban copper scrap imports, coupled with higher than expected mine depletion, strong demand, and decreased mine productivity (strikes at world-class mines) caused copper to increase 5.7% this week through Thursday's close.
This week's roll-out of an affordable Tesla may have also caused analysts to begin increasing their projections for the global demand of copper. The average American car has approximately 55 pounds of copper wiring, while electric cars require closer to 150 pounds. As a result, the International Copper Association increased copper demand for cars and buses from 185,000 tons in 2017 to 1.74 million tons in 2027. The near ten-fold increase would represent 7% of today's global copper production. Moreover, years of depressed copper prices caused copper miners to defer green field projects. They, instead, increased output via smaller brown field expansion projects, which have already come on the market. Freeport McMoRan's CEO, Richard Adkerson, highlighted on a recent conference call that the market would require prices to remain north of $3.00 per pound in order to incentivize new mine investment. From there a new mine would take between five and ten years to start producing copper ore. These projected changes in supply and demand fundamentals are beginning to have a material impact on both the absolute price of copper and price ofcopper relative to that of gold.
The copper-gold ratio is calculated by dividing the market price of copper by the market price of gold. Copper is an industrial metal. It is used in plumbing, electric wiring, and its anti-bacterial properties coupled with its malleability lend the metal to be used in medical equipment. Demand increases during periods when economic output is rising. Gold is a store of value. It is molded into ingots, bullion, or displayed as jewelry. Its actual industrial applications are limited. The differing uses of the metals has allowed the copper-gold ratio to act as an accurate barometer of global growth.
The ratio began the year on the weak side, but recently trended upwards and made a new high as of July 27, 2017:

Source: www.stockcharts.com
This indicates that growth is strong, which is supported by global PMIs and today's second quarter US GDP print at 2.6%.
In his 2017 outlook, Jeffrey Gundlach of DoubleLine highlighted that the copper-gold ratio is a powerful coincident indicator of the 10-yr Treasury yield. This is due to the fact that the copper-gold ratio and the real yield and inflation components of the 10-yr Treasury are highly correlated with global growth. As you can see (below) the 10-yr Treasury yield has exhibited a trend similar to the copper-gold ratio this year:
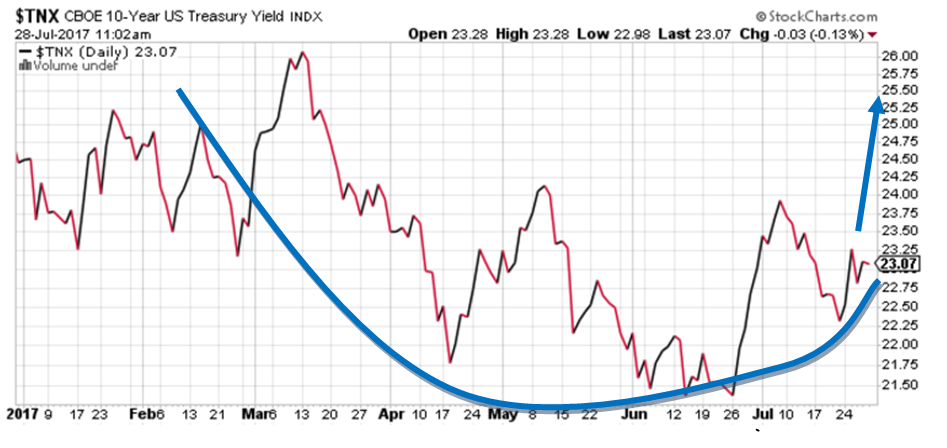
Source: www.stockcharts.com
However, the most recent upleg in the copper-gold ratio has been unmatched by an increase in Treasury yields. We expect that the real yield will move higher given improving economic prospects. We similarly expect that the inflation component will move higher given continued dovishness from the Federal Reserve coupled with higher oil prices. This should continue to benefit value stocks relative to their growth counterparts.