Stuyvesant Insight: Reflation Before Inflation

Reflation implies an increase in the rate of inflation from below trend towards the Fed's long-run inflation goal of 2.0%.  It is often fueled by fiscal and / or monetary stimulus, which serves to increase aggregate demand.  The reflation trade that began in late 2016 was catalyzed by market hopes that deregulation, tax cuts, and infrastructure spending would be quickly implemented after the 2016 Presidential election.  This resulted in cyclicals / value stocks significantly outperforming their defensive / growth counterparts.  This trade reversed due to disappointing first quarter GDP (1.2%) and the now uncertain implementation of Trump's platform.  In spite of this a new reflation trade was born.

The new reflation trade is a result of the decline in the price of WTI crude oil, the US dollar, and long-dated Treasury yields in the first half 2017. This is a powerful combination for increasing for final demand.  Effectively, this serves as a tax cut to workers via an increase to real disposable income (decreasing the percentage of household income directed to the non-discretionary oil-related outlays); an increase in global demand for our goods and services via devaluation of the dollar; and a decrease in the cost of capital investment due to the decrease in borrowing costs, which should support fixed capital investment.  In fact, US economic conditions have become increasingly reflationary despite the Fed tightening monetary policy by increasing the Fed Fund's rate three times over the past eight months (December, March, and June) to a range of 100-125 bps.


This is corroborated by Stuyvesant's Reflation Study, a leading indicator:

The Stuyvesant Reflation Study is calculated as the inverse of an equal-weighted index of Z-scores that are computed for oil prices, 10-year Treasury yields, and the US dollar on a monthly basis.  When this index trends above the zero-bound, it indicates that the economy is undergoing a reflationary impulse and when it is below the zero-bound it indicates that conditions are becoming restrictive.  A powerful up thrust began in late 2016 and continues through June of 2017.  Our study has historically been a leading indicator for the US Economic Surpirse Index shown below:

Citi's U.S. Economic Surprise Index measures the difference between expected economic versus actual data, smoothed over the past three months, weighted for the most recent releases.  When data beats analyst expectations the index trends up and when data misses the index trends down.  Given the propensity of our reflation study to lead the economic surprise index, we expect that the strong reflationary impulse will lead to positive economic surprises.

The New York Nowcast currently forecasts 2Q17 GDP growth at 1.90% and the Federal Reserve Bank of Atlanta's GDPNow model forecasts 2Q17 GDP growth at 2.5%.  We expect US GDP to grow at approximately 2.2% for the second quarter.  This is a long ways away from President Trump's 3.0% goal, but is greater than the Fed's projection of 1.8% potential growth.  The reflation trade should cause domestic growth to  accelerate into the back half of this year.  With second quarter economic growth already running above potential and tightness in the labor market (U-6 at 8.6%, which is near the low prior to the Great Financial Crisis), we continue to anticipate that yields will rise in the back half of 2017, led by inflation.  Any additional fiscal stimulus, financed through deficit spending, should be construed as a positive surprise and will exacerbate the reflationary trend.


Stuyvesant Insight: An Oil Price Reversal Should Benefit TIPS

The West Texas Intermediate Crude Oil price declined from a peak daily close of $54.04(02/27/2017) to a trough daily close at $42.53 (06/22/2017), a decline of 22%.  This was, in part, caused by the net-long speculative positioning in oil futures that were put on after OPEC agreed to reduce output for the first time in eight years in November of 2016 being unwound.  This liquidation began in March 2017 as global oil inventories proved more resilient than most analysts had anticipated  (below).

Source: investing.com

Source: investing.com

Analysts appear to have revised down their estimate for yearend 2017 WTIC prices.  In fact, many sell side analysts appear to have capitulated and stated that oil may break $40 per barrel since risk remains to the downside.  We believe that the en masse downgrade of oil service and exploration / production firms by sell-side analysts is indicative of a contrarian buy signal.

Over the last two weeks US inventories have begun to decline at an accelerating rate, while new-well productivity gains in the prolific Permian basin have declined (below).

Source: EIA Drilling Productivity Report

Source: EIA Drilling Productivity Report

This indicates that, without the addition of rigs to this basin, total basin production would have declined since the start of 2016.  The recent decrease in oil prices should lead to the deceleration in the rate that rigs are deployed, which could cause total US production to underwhelm analyst estimates and support oil prices.  In fact, we expect oil prices to close the year somewhere between $55.00 and $60.00 per barrel.  This could catalyze inflation expectations higher, which would lead to a pickup in the moribund inflation level and pressure bond prices.

This is due to the high correlation between WTIC oil prices and the 5-Year, 5-Year Forward swaps, a proxy for inflation expectations (below).

source: www.stuyvesantcapital.com

source: www.stuyvesantcapital.com

The coefficient of determination (R2) where inflation expectations are the dependent variable and oil prices are the independent variable registers 0.71.  This indicates that 71% of the level of inflation expectations are dependent on the price of WTIC.

We performed a simple exercise to determine where inflation expectation could end up if oil ends the year in our forecasted range of $55.00-60.00 per barrel.  To do this we determined the percent advance that oil would make from its 2017 trough to our high and low estimates.  We then adjusted that percent change by our R2 calculation to determine what percent change inflation expectations should experience due to the increase in oil prices, which allowed us to forecast a range for inflation expectations (below).

source: www.stuyvesantcapital.com

source: www.stuyvesantcapital.com

We expect that, if our oil forecast come to fruition, the 5-Year, 5-Year Forward Rate of Inflation Expectations will advance by approximately 37 to 52 basis points to a range of 2.15 to 2.30.  Since inflation expectations are known to lead inflation, we expect that a comparable increase in the 10-year Treasury yield could ensue caused by an increase inflation component.  This forecast could be enhanced or dampened by extraneous factors that are responsible for the, approximately, 30% of movement of inflation expectations not explained by the price level of WTIC.  As per our previous writings, given that the US economy is growing above potential and that the U3 unemployment rate is below the Fed's estimation of NAIRU, we would expect surprises to remain to the upside.  This leads us to expect Treasury Inflation Protection Securities to outperform nominal Treasuries.

Stuyvesant Insight: Private Credit Demand Trends Higher

Loans and leases of all commercial banks is a data series that is reported by FRED on a weekly basis.  This series tracks the total outstanding loans and leases within the commercial banking sector, including: mortgages, auto loans, consumer credit, commercial and industrial loans.  It is highly indicative of private sector activity.

Bank shares stalled the first six months of this year due to both a narrowing in the net interest margin (spread between banks assets and liabilities that determines its profitability) as well as a flat-lining in total bank credit (quantity of loans made, which are banks assets).  Recently, the 2-10 Treasury spread, which is a proxy for the NIM, has begun to expand.  It currently stands at roughly 98 bp after contracting to 78 bp on June 26, 2017.  More importantly, lending appears to have accelerated.

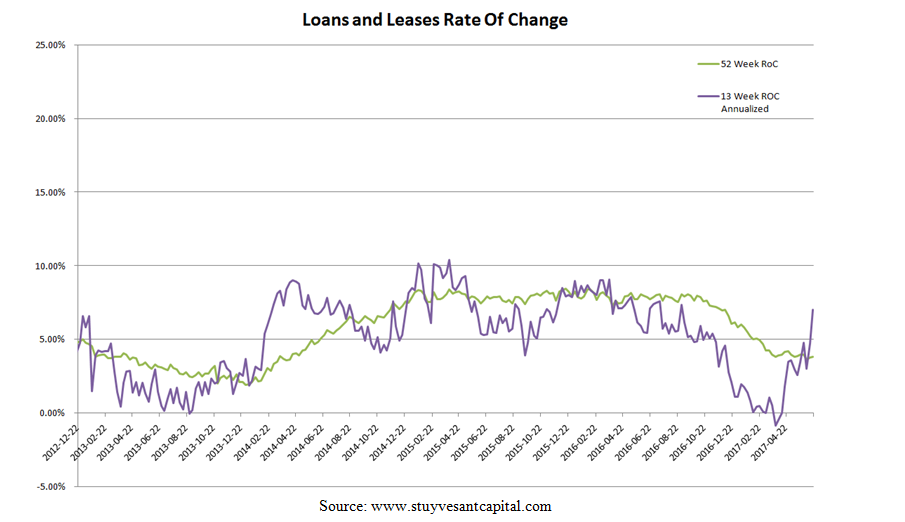
The graph (below) highlights the 52 week rate of change in loans and leases of all commercial banks and the annualized 13 week rate of change in all commercial banks. 

loans and leases.PNG

While the 52 week rate of change of loans and leases of all commercial banks (henceforth loans and leases) has only stabilized and trended sideways, the more volatile 13 week rate of change annualized of loans and leases has shown a rapid acceleration.  In fact, it is now running at a level commensurate with its average between 1Q14 and 3Q16.  This series has been a leading indicator for the 52 week loans and leases series, which implies that yoy loan growth should improve.  This indicates that private activity is strengthening.

This is supported by today's nonfarm payrolls report which showed an increase of 222,000 in June and an increase in labor force participation to 62.8% , this week's ISM non-manufacturing index at 57.4%, and the ISM manufacturing index at 57.8%.  Moreover, the Atlanta Fed GDP Now model currently forecasts a growth rate of 2.7%, which is significantly greater than the Federal Reserve's estimate of long-run potential growth.

Even though wage inflation was today reported at a tepid 2.5%, it is still in excess of May's trimmed mean PCE inflation rate of 1.5%.  This indicates that real wages are rising, an inflationary phenomenon.  If energy prices can stabilize, inflation expectations should begin to increase.  I would therefore expect that the upward trend in bond yields to continue given strength in both the real and inflationary component.  Positive trends in private credit demand and an expansion in the net interest margin bodes well for bank profitability

Stuyvesant Insight: Value to Outperform Growth

Below is a screenshot of the performance of the S&P 500 value index relative to the S&P 500 growth index:

V to G.PNG

There has been a dramatic underperformance of value year-to-date (-9.83% through May).  However, the RSI (measure of relative strength) and the MACD (measure of momentum) have perked up from deeply oversold levels and are trending higher.  Moreover, the value index began an outperformance phase in early June.  We expect this phase to continue.

Growth stocks' earnings increase at a stable rate.  As a result, investors will assign more certainty to earnings forecasts and will discount them further into the future when computing their present value.  This causes growth stocks to have a longer duration, a measure of risk used in computing certainty of cash flows.  An increase in bond yields results in an increase to the discount rate applied to the company's future cash flows, which has a disproportionately negative impact on the net present value of growth stocks.  Investors are less willing to pay up for growth stocks if their earnings aren't positively impacted by improving global growth and their valuations are more susceptible to rising interest rates.

The earnings ofvalue stocks are cyclical.  Their earnings accelerate during periods of strong global growth and decelerate during periods of weak growth.  As a result, investors discount their earnings over a couple of years, resulting in shorter duration securities.  Therefore, a period of rising yields, due to accelerating growth, tend to disproportionately favor both the earnings and valuation of value stocks relative to that of growth stocks.

These observations have supported the relative outperformance of growth to value this year.  Firstly, weakened 1Q17 domestic growth negatively impacted projected earnings of value stocks relative to growth stocks.  Secondly, the yield of the 10-year Treasury peaked in February at 2.60% and has since trended lower in a parallel fashion with the value-to-growth ratio:

Stuyvesant's June 3Q17 Investment Outlook highlighted that the path of least resistance for bond yields is up.  A powerful rally in yields has since ensued, catalyzed by hawkish international central bankers and strong global economic data.  We expect this trend will continue,  favoring the continued relative outperformance of value stocks.

Quarterly Investment Outlook: June 2017

SUMMARY

  • Stronger domestic growth is needed to validate the expansion in p/e multiples since year-end, which is our base-case given 2Q17 growth is projected to be 3%.


  • Inflation rates and breakevens have declined in 2017, but we view this condition as temporary.  Despite a moderation in U.S. economic growth, financial conditions remain accommodative and global activity has gained momentum.  Brexit talks could be contentious. Weighing all of the above, we see little reason for the Fed to alter its rate hiking path.  We continue to expect one hike in June to be followed by another in December.  The September meeting could feature preliminary discussions on downsizing the balance sheet.


  • A rebound in economic growth and inflation will depend on an improvement in money velocity.  We are somewhat encouraged that the momentum of velocity is slowly improving.  An increase in business borrowing would accelerate this trend.  Loans and leases in all commercial banks are expanding at 3.9% yoy.


  • We expect any correction to be brief, possibly to the 2250 level on the S&P 500, and to be followed by a resumption of the cyclical bull market.  Looking out into early next year, we see some potential dark clouds on the horizon.  Specifically we are concerned about the Fed's desire to reduce its $4.5 trillion balance sheet.  Should this result in a reduction in excess reserves, it would lead to a significant tightening in financial conditions.  Stay tuned!

To access the full report click here

Quarterly Investment Outlook: March 2017

SUMMARY

  • We continue to expect a grinding cyclical recovery with an upward bias to bonds yields.  However in the near term:  equity markets are extended, momentum is rolling over, and sentiment is elevated, pointing to a period of consolidation/correction.  Bond yields are correcting their 4Q16 advance and could test 2%, at which point we intend to move to below average duration.
  • The slowing growth in non-farm hours worked, lack of upward momentum in non-defense capital goods orders, and the elevated level of Economic Surprise Index makes us skeptical of analysts' earnings forecast of 10% growth in 2017.
  • Monetary policy is set to tighten over the next two years.  The forward 12 months  p/e ratio at 18x is at a decade high.  Eroding margins and rising interest rates will limit further multiple expansion.
  • CBO budget projections forecast that deficits/debt should trend higher over the next ten years, reflecting increases in both health and retirement benefits.  This assumes modest growth and no recession, which most analysts, including ourselves, believe is far too optimistic.  As of this writing there is little clarity regarding Trump's fiscal plans, including the extent to which they will be deficit neutral.  In the end, tax relief and infrastructure spending are pro-growth.  However they could be largely offset by a border tax and/or targeted tariffs.  Tariffs can be implemented by executive order and would represent a potential roadblock to our cyclical recovery thesis, and a continuing bull market in risk assets.
  • The equity market is fully valued as shown in our proprietary earnings and dividend discount model.

To access the full report click here

Quarterly Investment Outlook: January 2017

SUMMARY

• The essence of Trumponomics appears to be 1) a tougher stance on immigration, 2) to  renegotiate existing trade agreements if possible,  3) implementation of tariffs on Mexico/China ranging from 35% - 45%, 4) to reduce marginal personal tax rates from 39.6% to 33%, while simplifying the income tax bracket from seven to three, 5) to reduce corporate rates from 35% to 15%, 6) an increase in infrastructure and military spending, 7) to curb regulation. 
 
• Since 2009 real GDP has averaged 2.1% CAGR.  Measured on a yoy basis, the gain for 2016 is a meager 1.7%.  The Federal Bank of Atlanta GDP tracker is currently forecasting Q4 growth of 2.4%, bolstered by rising consumption, residential investment and equipment purchases.  The outlook for increased fiscal stimulus, noted above, could result in GDP growth of 3% in 2017. 
 
• Business confidence feeds off of the consumer.  In this regard it is encouraging that the Michigan Consumer Sentiment, a measure of consumer confidence, came in at 93.8 for November, up from a forecasted reading of 91.6.  This is a positive development as the initial reaction of the consumer to Trump's victory was to express optimism about their personal finances and improved prospects for the economy. 
 
• The reaction to Trump's election was immediate and was expressed in higher stock prices, rising treasury yields, and a stronger U.S. dollar.  The S&P 500 at 2213 now trades 5.2% above its 200day moving average, which indicates an overbought market.  We are concerned that the advance has been narrow, with the NYSE Advance/Decline Line, a measure of market breadth, failing to confirm the recent new highs in the S&P 500.  In addition, our valuation analysis shows the market has already largely discounted expected earnings growth of 9% for 2017. 
 
• Dollar strength is pressuring corporate earnings, which just recorded their first positive yoy gain in seven quarters.  Margins are under pressure from rising unit labor costs and nominal revenue growth.  Rising interest costs will also pressure forward earnings with corporate leverage having risen in the past several years, due to companies buying back shares.  Domestic companies are in the best position to benefit, especially those with pricing power.  Oil and gas shale producers are our favorite industry choice. 
 
• In order to move from a defensive to cyclically biased strategy, we need to see more evidence of 1) real fiscal stimulus, 2) clear signs of a recovery in global growth, 3) a pause or reversal in the dollar's advance, with strength in EM currencies, 4) a steepening in the yield curve, 5) continuing advance in the stock/bond ratio.  Preliminary signs point to increasing economic momentum in both China and the U.S., which are major drivers of global growth.

To access the full report click here

Quarterly Investment Outlook: September 2016

SUMMARY

·Fed policy appears to be shifting toward price level/nominal GDP targeting.  A price level targeting policy is geared to raising inflation expectations, thereby creating a backdrop conducive to increase spending.  Maintain core TIPS holdings as a hedge.

·Treasury yields are at risk of moving higher.  We calculate "fair value" at 2.3%, using the 10-year maturity.  An overshoot to 2.5%+ would create a buying opportunity.

·The oil markets have largely rebalanced according to energy analyst Matt Conlan, at BCA Research.  We believe there is increasing risk of a spike upwards in 2017.

· Global growth is stagnant, but marginally positive.  Policymakers in the U.S./China, which collectively account for roughly 38% of global GDP, are slowly shifting to targeting more stimulus via fiscal thrust.

·The S&P 500 has entered an overshoot phase, which could ultimately reach 2400.  Over the intermediate-term the market is overbought and may consolidate/correct its recent gains above 2050.

· We are maintaining our defensive industry core holdings, while selectively adding cyclical exposure.  Our foreign holdings in China "H" shares, Japan (currency hedged) and Europe offer better value.

To access the full report click here

Stuyvesant Insight: The Flight to Safety Makes Treasuries Expensive

Recent flows into long duration Treasuries has resulted in yoy out performance of Treasuries relative to the S&P 500 that is currently approaching the one sigma mark, a sign of statistical significance (68% of data are observed between the one σ bands).  This is indicative of a prevailing pessimistic outlook with respect to both growth and inflation that has only occurred over two periods in the past decade, The Great Financial Crisis and The European Debt Crisis.

We believe that the current search for safety, resulting from the Brexit Vote, is becoming overdone and that the political response will be looser monetary and fiscal policy out of Europe, Japan, the U.S., and China.  This is likely to put a floor under depressed yields.  We believe that this valuation metric is evidence that the time is approaching to be sellers rather than buyers of domestic sovereign debt and will continue to look for opportunities to take profits in bonds.

Quarterly Investment Outlook: June 2016

SUMMARY  


• The treasury yield curve has flattened from 140 basis points (2/10 year spread) at year end 2015 to 96 basis presently.  Historically, a flat yield curve has been positively correlated with slower GDP growth. 
• Despite the fact that short rates are rising faster than long-term rates, causing the U.S. dollar to rise 3.8% from its May low, the Fed minutes released on 5/18 gave a strong indication that a June Fed funds rate hike is probable.  
• In December of last year, despite evidence the U.S. economy was slowing, the Fed hiked rates by 25 basis points.  The result was a 13% decline in stock prices into mid-February.  In our opinion, another risk off trade would take a June hike off the table.  
• Global growth appears to be converging.  U.S. growth is slowing, evidenced by employment trends which have averaged 192K during the first four months of 2016, down from an average of 248K in the final four months 2015.  Meanwhile, growth in Japan and Europe have shown positive trends in the first quarter.  The growth outlook in China is set to improve, with their economy benefiting from a weak RMB, tax cuts, a recovery in their property markets and increasing infrastructure spending.  
• Having risen roughly fourteen percent from the February low, the S&P 500 has been trending sideways since early April.  On a positive note, the market's 20-week exponential moving average has risen above its 50-week moving average.  In addition, the percentage of stocks on the NYSE trading above their 200-day moving average has been above 60%.  These positive technical trends were confirmed by a recent new high in the NYSE advance/decline line.    
• The latest Conference Board Leading Economic Indicators (LEI) for April increased 0.6 to 123.9.  The latest six months witnessed an increase in the LEI at the annual rate of 1.1%, down from 1.3% annual rate in the preceding six month period.  Of the 10 indicators, only consumer expectations declined.  Noteworthy, the series is approaching its all time high of 129 in 2007.  Our conclusion is more of the same for the U.S. economy i.e. slow growth but low probability of recession. 

To access the full report click here
  

Quarterly Investment Outlook: March 2016

  • The recent 10% correction in the S&P 500 since yearend resulted in the market becoming oversold, which was confirmed by extremely negative investment sentiment.
  • S&P 500 earnings expectations for 2016 have been revised downward to +2.8% yoy, according to Capital IQ.  This includes an estimated yoy earnings decline of -62% for energy companies.  Any recovery in oil prices could bolster overall earnings growth.
  • However global macro trends, as measured by global PMI and the leading indicators, have yet to signal recovery.  As such, we are maintaining a defensive investment strategy.
  • The markets have signaled tight financial conditions via declining equity prices, widening credit spreads, and plummeting inflation expectations since the Fed rate hike in December.  Recent Yellen testimony suggests the Fed will likely wait, at least until June, before hiking rates.  This would necessitate some revision to their dots plot, which calls for eight quarter point increases through 2017.
  • The global economy is in need of a prodigious fiscal spending program in order to drive growth in incomes.  This is probably unrealistic in a U.S. election year, unless the U.S. economy falls into recession.  China recently announced that more federal spending will be allocated to local governments in an effort to boost spending.
  • The bottom line is that we expect markets (both equities and bonds) to be in a broad trading range this year.  Tactical investment strategies will be used in an effort to generate alpha. 
  • The dollar has weakened, but has yet to breakdown.  The spectra of the Fed raising rates later this year may keep a bid under the currency and limit any advance in commodity prices beyond the next month or two.  

To access the full report click here.

Quarterly Investment Outlook: January 2016

SUMMARY

  • The Fed is determined to increase the Fed funds rate on 12/16.  We are concerned that they could be making a policy mistake.  The expectation of the first rate increase in nine years has pushed up the value of the U.S. dollar 19% over the past eighteen months.  Depressed inflation expectations could pressure the Fed to pursue a shallower rate path into 2016.
  • A rising dollar over the past eighteen months is the equivalent of de facto Fed tightening of financial conditions by an estimated 200 basis points worth of rate increases.
  • Slowing new orders for capital goods, coupled with tepid growth in credit is signaling economic growth may be decelerating.  Both the GDPNOW model and Economic Surprise Index are decelerating.
  • The stock market expects earnings growth of 8% in 2016.  This may prove too optimistic unless the U.S. dollar corrects.
  • Maintain a defensive investment strategy favoring bonds over stocks and foreign equities vis a vis domestic.
  • Commodities are in a secular bear market, but the dollar could correct and decline subsequent to the Fed raising rates, which would give commodities a cyclical boost.  Watch Saudi oil production for signs the Kingdom wants higher prices.

To access the full report click here


Quarterly Investment Outlook: September 2015

SUMMARY

  • In a highly indebted global economy where producers are trying to capture a larger piece of a smaller pie, no country can tolerate an overvalued currency for long.
  • During the last three years, we have witnessed successive devaluations in all major currencies i.e. Euro, Yen, Aussi dollar, loonie, rouble, Brazilian real and most recently China's remnimbi.  The U.S. dollar could be next
  • 3Q GDP is tracking at 1.3 percent according to the Fed Atlanta Bank's tracking model.  Should growth slow to 1-2 percent, employment gains will register sub 200K per month.
  • We believe financial markets are rioting and beckoning Fed policy makers for reflation.  A fed rate hike is highly unlikely over the balance of 2015 and QE4 is possible.
  • Gold is breaking out to the upside and other commodities may follow suit.
  • China needs to step up its reflation efforts.
  • U.S. bonds will outperform equities, until the reflation trade is discounted by a recovery in the EM currency markets.

To access the full report click here

Special - Part I: The Unintended Consequences of Passive Investing

Passive management began to capture market share in the aftermath of the 2008 financial crisis.  This shift was due to the realization that the comparatively higher fees charged by active managers would eclipse the alpha (excess returns) that they were able to generate.  This has lead to the belief that passive modeling of the index will outperform an actively managed strategy.  Thus, targeting a low tracking error (the standard deviation in excess of the market) / low fee strategy will deliver the best net performance per market risk.  This paper is a thought experiment that will examine:

  1. The creation of passively managed index funds.
  2. The impact on the equity market as passive funds continue to capture market share.
  3. The use of benchmarks by investment professionals.
  4. The evolution of active management in response to passive management.

To access the full report click here

A special thanks to the CFA Institute's Level III program for influencing my thoughts on this topic

Quarterly Investment Outlook: June 2015

SUMMARY

  • Dollar strength should fade.
  • Fed Bank of Atlanta's GDP tracking model puts 2Q15 growth at 0.8%.  Our base case is the U.S. economy will struggle to grow above 2-2.5%.
  • We are revising earnings growth for 2015 to flat from +6%.  Margins are pressured by lack of pricing power and rising wage costs.
  • Treasury yields could drift lower over next several months if oil prices reach a plateau and the FOMC members revise their Fed funds forecast ("dots") lower.
  • Given that equity valuations are elevated, our portfolio strategy is defensive.  We are seeking alpha in select foreign markets, energy, health care, and financials.  Maintain core position in investment grade corporates.  Hold gold miners as a hedge against market volatility and a weak dollar.

To access the full report click here

Quarterly Investment Outlook: March 2015

 SUMMARY

  • A Fed rate hike is dependent upon inflation moving higher.  We are watching service prices, which may signal a change in trend.  A strong dollar is also depressing goods prices.  A September increase seems likely.
  • Meanwhile consumer spending may have finally started benefitting from lower energy prices and solid employment gains.  However, we are monitoring the four week moving average of unemployment claims (currently at 294,500), which has failed to make a new low for sixteen weeks.  This is becoming a troubling trend.
  • Core capital goods orders, less transportation and defense, rose 0.6% mom.  This is the first rise following four consecutive monthly declines, and it is only up 4.2% yoy.  Business spending appears sluggish.
  • Consensus operating earnings for the S&P 500 have been revised downward to 120.37, up only 2% from 2014.  Forecasts for 2016 (136 expected) appear too high.  At 16x our estimate of 128 for 2016, the S&P 500 should trade at 2050.  At a minimum, the market appears fully valued.  With interest rates at zero in the US and QE underway in Europe and Japan, liquidity is flowing freely.  An equity overshoot phase is possible!
  • Treasury yields have risen lately reflecting stronger growth in the US, while excess liquidity in Europe is depressing bund yields (30 basis points).  The wide spread between US/Germany is benefitting both the US dollar and US treasuries.  Any softening in domestic growth would cause treasury yields to test 1.5%.  Investment grade credits offer attractive yield pickup.

To access the full report click here

Quarterly Investment Outlook: December 2014

SUMMARY

  • U.S. real GDP growth is tracking at 2.2%, which is roughly in line with real income less transfer payments.  This is close to estimated potential GDP growth of 2% (.5% from labor force plus 1.5% labor productivity).
  • Bloomberg consensus growth estimates for 2015 are 3% for the U.S. economy.  This seems high.  Nevertheless, growth should get a boost from an accommodative Fed, modest fiscal drag, low interest rates and the recent decline in oil prices.
  • The Eurozone will continue to struggle under the weight of high debt/GDP in the peripheral countries, which may be exacerbated by the ECB’s inability to initiate QE.  However, following the Asset Quality Review, banks should be more willing to extend credit to small businesses and households.  Low interest rates and oil prices should also buoy aggregate demand, coupled with the lagged effect of a weaker euro.  Eurozone equities remain cheap as they trade at roughly a 50% discount to the U.S. on a cyclically adjusted price earnings ratio.  The bar for a period of outperformance is low.  The European Economic Surprise Index has bottomed and is moving higher.  Spanish banks look attractive!
  • In Japan, Abenomics (code word for massive yen devaluation), has generated a yoy inflation rate of 0.9%, with the country still mired in recession.  Unfortunately the "third arrow" (consisting of structural reforms) is nowhere to be found. Other Asian nations have seen their currency weaken recently, so it's unclear whether Japan's strategy is working.
  • A recent PBOC decision to lower policy rates in China has boosted investor confidence. The Shanghai Composite has broken out of a seven year bear market.  Borrowing costs remain high for small businesses, which has resulted in a lack of credit demand.  More stimulus will be needed!
  • The above average strong performance of long duration U.S. treasuries is getting "long in the tooth."  Early in 2014 few investors were concerned with deflation.  Most expected yields to rise and maintained fixed income portfolios that were short duration.  The collapse in oil prices, due largely to a supply shock, has caused bond investors to panic into treasuries, extrapolating that the decline in inflation expectations will lead to a decline in general price level inflation.  We take this as a contrarian signal and expect to dial down our risk profile and reposition fixed income portfolios to average duration on future market strength.
  • While modest U.S. growth and stable inflation is positive for U.S. equities, at 16x forward estimates the S&P 500 has already discounted this "Goldilocks" environment.  However, valuations have rarely been a good market timing tool.  With the Fed on hold, possibly for all of 2015, the market could witness a classic melt-up.  We intend to continue de-risking our client's portfolios and have officially adopted a cautious investment strategy.

To read the entire report click here

Quarterly Investment Outlook: October 2014

SUMMARY

  • Europe is on the precipice of a deflationary shock.  Fiscal and monetary stimulus must be enacted to prevent a deflationary spiral.  Monetary stimulus will not be enough.
  • Low European sovereign yields will continue to fuel the carry trade into the Treasury.  This will bolster the Dollar and may negatively impact our export market.  Labor market trends will not provide historic support to the real yield component of long-term Treasuries.
  • Low domestic yields remain a tailwind to domestic equity pricings.  While shocks to our system may occur, the path of least resistance is up for equities.  However, the market could be vulnerable to a correction with QEIII set to end next month.
  • Chinese equity markets may have broken out of a six year bear market.  They are supported by their cheap fundamentals and reforms that have been enacted under President Xi and Premier Li.  Weakness in the Chinese economy may lead to a cut in the SHIBOR rate, which would be another bullish development for Chinese equities.

To read the entire report click here